Quick Summary: FRM Pass Rates at a Glance
If you are researching the FRM pass rate before deciding whether to attempt the exam, here is what the data shows before we go deeper:
- FRM Part 1 pass rate (recent years): approximately mid-40s percent, broadly stable across recent sittings.
- FRM Part 2 pass rate (recent years): approximately mid-to-high 50s percent, consistently higher than Part 1.
- Long-run 10-year averages: Part 1 averages roughly 46–48%, Part 2 averages roughly 55–58%.
- FRM Part 1 pass rates have generally been higher than CFA Level 1's long-run average, while ACCA individual paper pass rates vary widely by paper.
- Indian candidates broadly track global averages — GARP does not publish country-specific pass rates.
Official pass rate data is published by GARP (Global Association of Risk Professionals) after each exam window. Always refer to GARP for the most up-to-date figures.
Key Takeaway
The FRM is a genuinely difficult exam — roughly one in two candidates fails Part 1 on any given sitting. However, with structured preparation of 200+ hours and a quality study plan, beating the average pass rate is very achievable. The numbers should motivate you to prepare seriously, not discourage you from attempting.
What Are FRM Pass Rates and Why Do They Matter?
The FRM pass rate is the percentage of candidates who receive a passing score in a given exam window. GARP administers the FRM exam in two parts — Part 1 and Part 2 — offered in the May, August and November windows (see our FRM exam dates hub for the current calendar and deadlines). Pass rates are calculated separately for each part and each exam window.
Pass rates matter for several reasons. They signal the difficulty level of the exam relative to the candidate pool. They help you calibrate how much preparation is adequate. And they influence how employers perceive the credential — a lower pass rate generally signals higher rigour and selectivity, making the certification more prestigious.
For the FRM, pass rates have remained relatively stable over the past decade, hovering in the low-to-mid 40s for Part 1 and the mid-to-high 50s for Part 2. This consistency reflects GARP’s commitment to maintaining a consistent standard rather than adjusting difficulty year-to-year based on candidate performance.
How GARP Sets the Passing Score
GARP does not publish a fixed percentage cutoff. Instead, the minimum passing score (MPS) is determined separately for each exam administration by GARP's Board of Trustees, based on the difficulty of the exam form and overall candidate performance. GARP does not publicly disclose the exact MPS for any sitting.
What this means in practice: rather than chasing a specific number, candidates should focus on consistently scoring well across all topic areas in mock exams and practice questions. Candidates whose mock scores are comfortably above the 60–65% range across topics tend to be well-positioned, though no public threshold is guaranteed.
What Have Historical FRM Part 1 Pass Rates Been?
The FRM Part 1 pass rate has held in a ~45–46% band pre-2020 and a ~46–48% band from 2024–2025, per publicly reported figures from GARP's official exam-results disclosures, with the 10-year long-run average at roughly 46–48%. Specific per-sitting figures should always be verified directly with GARP, which publishes pass rates after each exam window.
| Period | Approximate Pass Rate | Notes |
|---|---|---|
| Long-run 10-year average | ~46–48% | Stable band over the past decade |
| Pre-2020 (typical) | ~45–46% | Range-bound across windows |
| 2020 (November only) | ~mid-40s | May 2020 exam was disrupted by COVID-19; check GARP for specifics |
| 2021–2023 | ~mid-40s | Stable; no major dip post-COVID |
| 2024 | ~46–48% | Consistent with long-run average; refer to GARP for exact window figures |
| 2025 | ~46% | Consistent with long-run average; refer to GARP for exact window figures |
Note: GARP publishes the official pass rate for each exam window. For exact year-by-year figures, always refer to GARP's official exam-results page. The May 2020 sitting was disrupted by the COVID-19 pandemic.
Illustrative range only. Refer to GARP's official exam-results page for verified pass rates for each window.
Key Observations: Part 1
The Part 1 pass rate has been remarkably stable in a narrow band over the past decade, with a 10-year average in the high-40s percent range. Post-COVID, pass rates have remained broadly consistent with the long-run average — there is no evidence of a major structural dip.
FRM Part 1 is considered the harder of the two parts for most candidates. The quantitative intensity of Valuation and Risk Models, combined with the breadth of Financial Markets and Products, catches many under-prepared candidates off guard.
What Have Historical FRM Part 2 Pass Rates Been?
The FRM Part 2 pass rate has held in a ~55–60% band pre-2020 and a ~55–60% band from 2024–2025, with a 10-year long-run average of roughly 55–58% — consistently higher than Part 1. For exact figures by exam window, refer to GARP's official exam-results page.
| Period | Approximate Pass Rate | Notes |
|---|---|---|
| Long-run 10-year average | ~55–58% | Consistently higher than Part 1 |
| Pre-2020 (typical) | ~55–60% | Stable across windows |
| 2020 (November only) | ~mid-50s | May 2020 disrupted by COVID-19 |
| 2021–2023 | ~55–58% | Stable post-COVID |
| 2024–2025 | ~55–60% | Consistent with long-run average; refer to GARP for window-level detail |
Part 2 pass rates have generally remained in the mid-to-high 50s percent range over the past decade. They are consistently higher than Part 1 — primarily because candidates who reach Part 2 have already cleared a difficult exam, so the candidate pool is more experienced and motivated on average.
Are FRM Pass Rates Rising or Falling?
Neither — FRM pass rates are range-bound, not trending. Part 1 has stayed roughly in the high-40s percent band and Part 2 roughly in the mid-to-high 50s percent band for over a decade, with no major structural shift post-COVID. GARP holds its competency bar steady rather than adjusting difficulty year to year, so a single recent window's number should not reset your expectations — the long-run average is the more reliable planning anchor.
Illustrative range only. Refer to GARP official disclosures for verified figures.
Are FRM Pass Rates Going Up or Down?
Looking at the long-run trend, FRM pass rates are neither consistently rising nor falling — they are range-bound. Part 1 stays roughly in the high-40s percent band and Part 2 stays roughly in the mid-to-high 50s percent band. Pass rates have remained fairly stable post-COVID, with no major structural shift in either direction.
This stability reflects GARP’s consistent standard-setting approach: rather than adjusting difficulty based on candidate performance, GARP holds the competency bar steady. For candidates, the implication is simple — expectations should not be set based on a single recent window’s headline number; the long-run average is the more reliable planning anchor.
The Part 2 Pass Rate Paradox
Many candidates are surprised that Part 2 has a higher pass rate than Part 1, given that Part 2 content (Market Risk Measurement, Credit Risk, Liquidity Risk) is considered more advanced. The explanation is self-selection: candidates who failed Part 1 are weeded out before they can attempt Part 2. The Part 2 candidate pool is therefore more experienced, more motivated, and better prepared on average. The content is harder, but the people taking it are stronger. This dynamic makes Part 2 feel more achievable than its syllabus complexity would suggest.
FRM Pass Rates vs CFA Pass Rates: A Direct Comparison
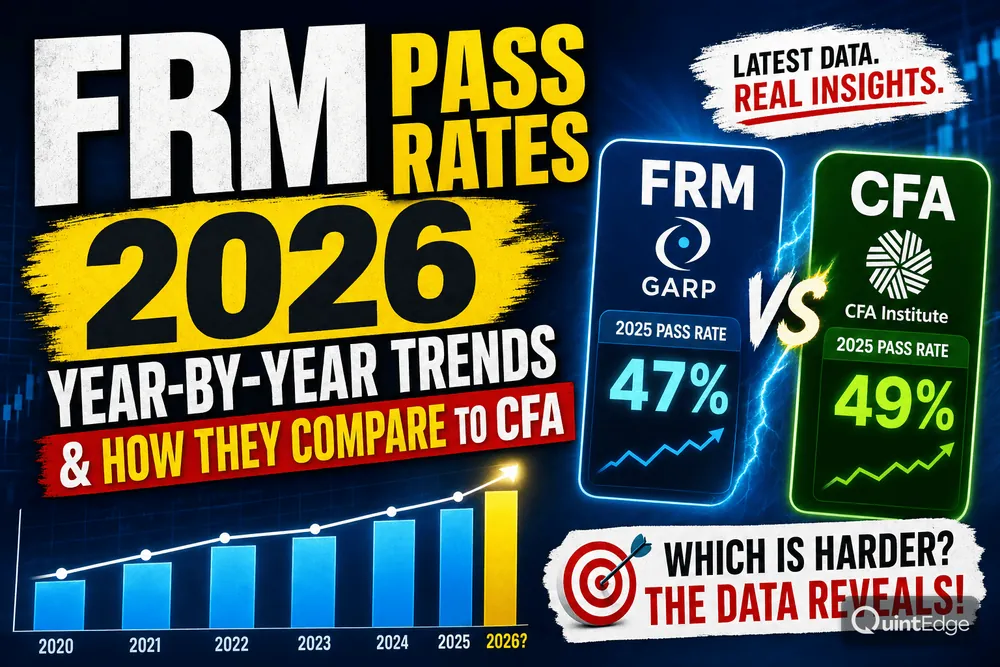
FRM Part 1 (~46–48% long-run average) has historically had a higher pass rate than CFA Level 1 (~40% long-run average), while FRM Part 2 (~55–58%) and CFA Level 3 (~50%) sit in a broadly similar range. The most common comparison finance candidates make is between the FRM and CFA in terms of difficulty, measured partly through pass rates — here is the full comparison.
| Exam | Typical Pass Rate Range | Long-Run Average |
|---|---|---|
| FRM Part 1 | ~mid-40s percent | ~46–48% |
| FRM Part 2 | ~mid-to-high 50s percent | ~55–58% |
| CFA Level 1 | varies widely by sitting | ~40% long-run; recent windows have varied |
| CFA Level 2 | typically mid-40s percent | ~45% |
| CFA Level 3 | typically high-40s percent | ~50% |
Several important points emerge from this comparison:
- CFA Level 1 has historically had a lower pass rate than FRM Part 1, though recent CFA Level 1 sittings have varied widely. For exact figures, refer to CFA Institute.
- FRM Part 2 and CFA Level 3 have broadly similar pass rate ranges, both in the high-40s to high-50s percent range depending on the sitting.
- Total probability of completing the full certification is generally lower for CFA (passing all 3 levels) than FRM (passing both parts), making CFA harder as a complete programme on a cumulative basis.
Key Takeaway
On a per-exam basis, CFA Level 1 has historically been harder to pass than FRM Part 1 by pass-rate measures. FRM as a complete two-part programme is generally easier to clear than the full three-level CFA. This does not mean FRM is easy — it means CFA is exceptionally long and demanding. Both certifications require serious, structured preparation.
Difficulty Beyond Pass Rates
Pass rates are only one dimension of difficulty. FRM is more intensely quantitative in a concentrated way — deep dives into VaR, Monte Carlo simulation, Basel capital adequacy, and credit risk modelling. CFA is broader, covering equity valuation, fixed income, derivatives, alternative investments, economics, ethics, and portfolio management across 900+ hours of study. Most finance professionals who have attempted both describe CFA as a longer endurance test and FRM as a shorter but more technically concentrated challenge. For a full comparison, read our CFA vs FRM in India guide.
FRM Pass Rates vs ACCA and CA: How Do They Stack Up?
Finance students in India often evaluate FRM alongside other professional qualifications including ACCA (Association of Chartered Certified Accountants) and the Indian CA (Chartered Accountant). Pass rates across these qualifications reveal important differences in exam structure and difficulty distribution.
| Qualification | Exam Structure | Typical Pass Rate Range | Notes |
|---|---|---|---|
| FRM Part 1 | 100 MCQs, 4 hours | ~mid-40s percent | Heavily quantitative; foundational |
| FRM Part 2 | 80 MCQs, 4 hours | ~mid-to-high 50s percent | Self-selection effect lifts the rate |
| CFA Level 1 | 180 MCQs, split session | varies widely by sitting | Long-run average historically lower than FRM Part 1 |
| ACCA Professional (P-level) | 3-hour written papers | varies widely by paper (typically 30–50%) | Refer to ACCA Global for paper-wise figures |
| CA Final (ICAI) | 3-hour written papers | varies widely by paper and attempt | Refer to ICAI for verified figures |
A few critical context points:
- CA Final has lower pass rates than the other qualifications in this list, partly because of a very broad candidate pool including many under-prepared candidates. Direct cross-comparison should be done with caution.
- ACCA professional papers range widely from one paper to another. On average, ACCA professional papers are broadly comparable in difficulty to FRM Part 1 by pass-rate measures, though structure and question style differ significantly.
- FRM pass rates have been relatively stable across sittings compared to some other qualifications where outcomes can fluctuate more.
- The FRM is an MCQ-based exam, whereas CA Final and ACCA are written subjective exams. This makes direct comparison of pass rates somewhat imperfect, as MCQ and written exams reward different skill sets.
Bottom line: FRM sits in the middle of the difficulty spectrum among major finance qualifications — broadly comparable to many ACCA papers, more accessible than CA Final by pass-rate measures, and broadly comparable in difficulty to CFA Level 1.
What Factors Affect FRM Pass Rates?
Six factors drive FRM pass rates: curriculum updates, candidate pool quality, the exam window (May, August or November), study hours and quality of preparation, math/statistics background, and the quality of mock-exam practice — with study hours and mock-exam practice being the strongest individual levers a candidate controls. Understanding why pass rates sit where they do helps you position your preparation strategy correctly.
1. Curriculum Updates
GARP periodically refreshes the FRM curriculum. When meaningful content changes are introduced, candidates prepared on older materials may face a mismatch with what is actually tested. Always use the current year’s GARP-approved study materials as your primary reference, even if you supplement with a third-party prep provider.
2. Candidate Pool Quality
As FRM grows in popularity, the candidate pool becomes more diverse. More candidates from non-quantitative backgrounds (commerce graduates, MBA students without strong statistics) are attempting the exam. This broadening of the base tends to put mild downward pressure on pass rates over multi-year periods, even as the exam difficulty remains stable.
3. Exam Window (May vs August vs November)
Pass rates between the May, August and November windows can vary, but the difference in any given year is usually modest. Choosing one window over the other rarely changes the difficulty meaningfully; the bigger driver is how much preparation time you have available before your exam date.
4. Study Hours and Quality of Preparation
This is the most powerful individual lever. GARP recommends approximately 200–240 hours for Part 1 and 180–220 hours for Part 2. Candidates who invest meaningfully less than this benchmark typically face an uphill battle, while those who hit or exceed it — particularly through structured programmes with mock-exam coverage — tend to outperform the global average.
5. Math and Statistics Background
FRM Part 1 is heavily quantitative. Candidates with strong mathematics, statistics, or engineering backgrounds typically outperform those from pure commerce or humanities backgrounds. Topics like probability distributions, regression analysis, Monte Carlo simulation, and bond duration/convexity require genuine mathematical comfort, not just surface-level understanding.
6. Quality of Mock Exam Practice
Research across professional exams consistently shows that mock exam performance is the strongest predictor of actual exam performance. Candidates who complete at least four to six full-length mock exams before the actual FRM have measurably higher pass rates than those who skip mocks and focus only on content review. Timing yourself under realistic conditions matters as much as knowing the material.
How Can You Beat the Average FRM Pass Rate?
The eight proven levers are: a realistic 200–240 hour study plan, mastering the quantitative foundation first, using GARP's official curriculum, keeping an error log, sitting 4–6 full-length timed mocks, prioritizing high-weightage topics, joining a study group or structured coaching, and reading GARP's after-exam insight reports. With a Part 1 pass rate in the mid-40s percent range, roughly half of candidates do not pass on any given sitting — here is how top performers consistently separate themselves from the pack.
1. Start With a Realistic Study Plan
Plan for 200–240 hours of preparation for Part 1, spread over 4–6 months. A realistic weekly study target of 10–15 hours is far more effective than cramming 40 hours in the final week. Block-schedule your preparation in advance and treat it like a recurring commitment, not a flexible activity.
2. Master the Quantitative Foundation First
The Quantitative Analysis section of Part 1 underpins almost every other topic in the FRM curriculum. Candidates who skip or rush this section consistently struggle with Valuation and Risk Models later. Spend disproportionate time on probability distributions, hypothesis testing, linear regression, and time-series models before moving to other areas.
3. Use GARP’s Official Curriculum
Always use the current exam year’s GARP curriculum as your primary resource. Third-party prep materials are valuable supplements but should not replace GARP readings, which are the primary source for exam questions. Pay special attention to Learning Objectives (LOs) — GARP questions map directly to published LOs.
4. Build an Error Log
Every time you get a practice question wrong, log it. Note the topic, the reason for the error (conceptual misunderstanding, calculation error, misread question), and the correct approach. Reviewing your error log weekly is one of the highest-value activities in FRM preparation. Most candidates who fail the exam fail the same types of questions they got wrong in practice.
5. Do Full-Length Timed Mock Exams
Complete a minimum of four to six full-length timed mock exams before your exam date. The FRM Part 1 is 100 questions in four hours — an average of 2.4 minutes per question. Many candidates who know the content well still fail because they cannot sustain concentration and pace for the full duration. Timed practice is non-negotiable.
6. Prioritize High-Weightage Topics
Not all topics are weighted equally. In FRM Part 1, Valuation and Risk Models and Financial Markets and Products carry the most questions. In Part 2, Market Risk Measurement and Management and Credit Risk dominate. Focus proportional study time on these areas rather than distributing effort uniformly across all sections.
7. Form a Study Group or Take Structured Coaching
The isolation of self-study is one of the biggest reasons candidates underperform. Structured coaching programmes provide accountability, expert guidance on hard topics, peer discussion, and exam strategy that self-study cannot replicate. Candidates at QuintEdge’s FRM programme consistently achieve pass rates well above the global average.
8. Read GARP’s After-Exam Reports
After each exam window, GARP releases insight reports on the topics that were most frequently missed by candidates. These reports are publicly available and provide invaluable intelligence on where the exam is focusing and where candidates collectively struggle. Incorporate these insights into your preparation for subsequent sittings.
Key Takeaway
The FRM pass rate is not a ceiling — it is an average that includes a large number of under-prepared candidates. With 200+ hours of structured preparation, timed mock exams, and focus on high-weightage topics, well-prepared candidates consistently outperform the global average by a wide margin.
Frequently Asked Questions
The FRM Part 1 pass rate in recent years has hovered around the mid-40s percent range, consistent with the long-run average. GARP publishes official pass rates on its website at garp.org/about-frm/exam-results after each exam window. Always refer to GARP's official disclosures for the precise figure for any specific sitting.
FRM Part 2 historically has a higher pass rate than Part 1, typically in the mid-to-high 50s percent range over the long run. This reflects the self-selection effect — candidates who attempt Part 2 are generally better prepared, having already cleared Part 1. For the exact figure for any given window, refer to GARP's official exam-results page.
FRM and CFA are difficult in different ways. FRM is more intensely quantitative and concentrated across two exams. CFA is broader in scope across three levels spanning 2.5 to 4 years. CFA Level 1 has historically shown a lower pass rate than FRM Part 1, though recent sittings have varied. Overall, most candidates consider CFA harder due to its length and breadth, while FRM Part 2 is considered highly technical in the risk domain. Always check the latest CFA Institute and GARP disclosures for current pass rates.
Most well-prepared candidates pass FRM Part 1 in one or two attempts and Part 2 in one attempt. With global pass rates in the mid-40s for Part 1 and mid-to-high 50s for Part 2, a statistically average candidate who is well-prepared can typically pass both parts within two to three exam sittings total. Following GARP's recommended preparation time of 200–240 hours for Part 1 and 180–220 hours for Part 2 significantly improves the odds.
The higher pass rate in Part 2 is primarily due to self-selection. Candidates who make it to Part 2 have already demonstrated they can pass a difficult quantitative exam. Many weaker candidates exit after failing Part 1 multiple times, meaning the Part 2 candidate pool is more experienced and motivated. The absolute difficulty of Part 2 content is high, but the calibre of the candidate pool taking it is also higher.
To beat the average FRM pass rate, aim for at least 200 hours of structured preparation for Part 1 and 180–200 hours for Part 2. Use the official GARP curriculum alongside a quality prep provider. Start mock exams at least 6–8 weeks before exam day and review weak areas using topic-wise analysis. Prioritize high-weightage areas: Valuation and Risk Models for Part 1, and Market Risk Measurement for Part 2. Candidates at QuintEdge who follow the structured programme report pass rates well above the global average.
Employers primarily care about whether you hold the FRM certification, not how many attempts it took. However, passing on the first attempt does signal strong preparation and analytical rigour, which can be a talking point in interviews. More important to employers is your ability to apply FRM concepts — model validation, VaR, stress testing, Basel compliance — in real-world settings.
Official FRM pass rates are published by GARP (Global Association of Risk Professionals) on its website at garp.org after each exam window. GARP releases the pass percentage for both Part 1 and Part 2 after each exam window — May, August and November. Always refer to GARP’s official communications for the most accurate and up-to-date figures.