PD, LGD and EAD at a Glance
PD, LGD and EAD are the three numbers behind every loan-loss estimate a bank makes. PD (probability of default) is the chance a borrower stops paying. LGD (loss given default) is the share of the loan the bank actually loses after recovering whatever it can. EAD (exposure at default) is the amount on the table when default happens.
Multiply the three together and you get expected credit loss (ECL) — in words: expected credit loss = chance of default × amount at risk when it happens × share of that amount actually lost. Banks use this one calculation to price loans, set aside provisions, and decide how much capital to hold.
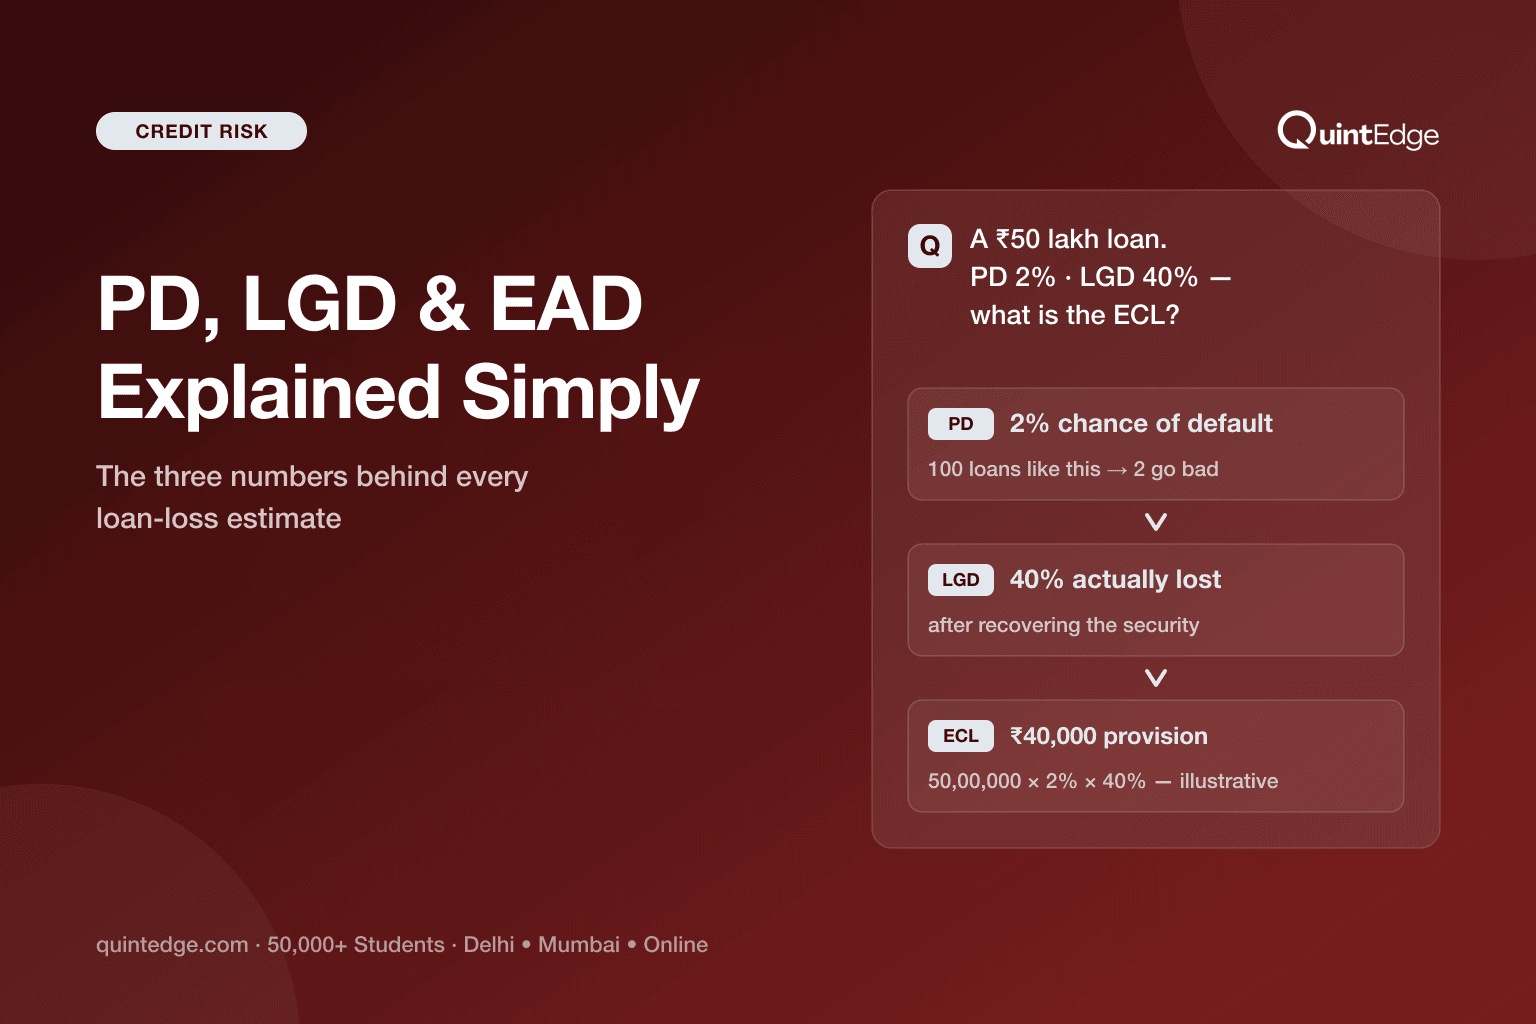
A quick illustrative example: a ₹50 lakh loan with a 2% PD and a 40% LGD produces an expected credit loss of ₹40,000 a year. That is not a guess about this one borrower — it is the average loss a bank should plan for across thousands of similar loans.
What Are PD, LGD and EAD?
PD, LGD and EAD each answer one plain question about a loan: how likely, how much, and how much lost. Put together, they turn a vague worry ("this borrower might not pay") into one clear number a bank can act on. Let's take each one separately.
PD — Probability of Default
PD (probability of default) is the chance a borrower stops paying back a loan, usually measured over the next one year. The Basel Committee on Banking Supervision — the global body that sets bank risk-management rules — defines it as "the average percentage of obligors that default in this rating grade in the course of one year" (BCBS, "An Explanatory Note on the Basel II IRB Risk Weight Functions", July 2005).
Think of PD like a weather forecast. A "20% chance of rain" does not mean it will rain 20% as hard — it means that out of 100 similar days, it rains on about 20 of them. A 2% PD means that out of 100 similar borrowers, about 2 are expected to default within a year.
LGD — Loss Given Default
LGD (loss given default) is the share of the loan a bank actually loses once a borrower has defaulted and the bank has tried to recover what it can. BCBS defines it as "the percentage of exposure the bank might lose in case the borrower defaults" — usually shown as a percentage of the amount at risk, and it depends on the collateral, the type of borrower, and how much the bank recovers by selling that collateral or pursuing legal recovery.
Use a simple analogy: imagine lending a friend ₹1 lakh against their laptop as security. If they stop paying and you sell the laptop for ₹60,000, you have lost ₹40,000 of the ₹1 lakh — an LGD of 40%. Better collateral or faster recovery brings LGD down; weak collateral or slow legal processes push it up.
EAD — Exposure at Default
EAD (exposure at default) is the amount of money actually at stake the moment a borrower defaults. BCBS defines it as "an estimate of the amount outstanding (drawn amounts plus likely future drawdowns of yet undrawn lines) in case the borrower defaults." For a term loan, EAD is close to the outstanding balance. For a credit card or a business credit line, EAD also has to account for the fact that people often draw more money right before they default.
Picture a credit card with a ₹2 lakh limit. If the cardholder has used ₹80,000 today but tends to max out the card before defaulting, EAD is not ₹80,000 — it is closer to the full ₹2 lakh limit, because that is the amount likely to be outstanding when default actually happens.
| Term | Plain-word question | Everyday analogy |
|---|---|---|
| PD — Probability of Default | How likely is this borrower to stop paying? | A weather forecast's "chance of rain" |
| EAD — Exposure at Default | How much money is at risk when it happens? | The full credit-card limit, not just today's balance |
| LGD — Loss Given Default | How much of that money is never recovered? | What you lose after selling the laptop held as security |
Plain-language takeaway: PD is a chance, EAD is an amount, and LGD is a percentage of that amount — three different units that combine into one loss estimate.
How Do They Combine Into Expected Credit Loss?
Expected credit loss (ECL) is PD multiplied by EAD multiplied by LGD — the chance of default, times the money at risk, times the share actually lost. The Basel Committee writes the formula as EL = PD × EAD × LGD. It is the single calculation that turns three separate risk numbers into one rupee figure a bank can price, provision, and plan around.
Here is an illustrative worked example using small, round figures. Suppose a bank has lent ₹50 lakh against a property, and its model estimates:
- PD = 2% — a 2% chance this borrower defaults in the next year
- EAD = ₹50,00,000 — the full loan amount would be outstanding if default happens
- LGD = 40% — after selling the property used as security, the bank expects to lose 40% of the exposure
| Step | Calculation | Result |
|---|---|---|
| 1. Start with the loan amount at risk | EAD | ₹50,00,000 |
| 2. Multiply by the chance of default | ₹50,00,000 × 2% | ₹1,00,000 |
| 3. Multiply by the share actually lost | ₹1,00,000 × 40% | ₹40,000 |
Plain-language takeaway: on this one illustrative loan, the bank should expect to lose about ₹40,000 a year on average — not because this exact borrower will default, but as the average across thousands of similar loans.
That ₹40,000 is not a prediction about this one borrower. It is an average — the loss a bank should expect across a large pool of similar loans, year after year. This average loss is exactly what pricing and provisions are built to absorb.
One more idea is worth knowing. Losses above this average are called unexpected losses — and a bank's capital, not its provisions, exists to absorb those. In the Basel Committee's words, banks cover expected losses "by provisions and write-offs," while unexpected losses "relate to potentially large losses that occur rather seldomly." Provisions handle the expected average; capital handles the rare bad surprise.
Where Do Banks Get These Numbers?
Banks estimate PD, LGD and EAD from their own past lending data, not from guesswork. They look at years of loan history — who defaulted, how much was recovered, how much was outstanding at the time — and use that history to build scorecards and statistical models that predict these numbers for new and existing borrowers.
For PD, a bank studies which kinds of borrowers defaulted in the past — their income, repayment history, credit bureau score, and existing debt — and builds a scorecard that ranks new applicants by risk. This is the same kind of model behind an instant loan approval or rejection.
For EAD, the bank looks at how customers behave right before default — do they draw down more of their credit line, or does the balance stay steady? That drawdown pattern becomes part of the EAD estimate for revolving credit like credit cards.
For LGD, the bank studies its own recovery history — how much it actually got back after selling collateral on past defaults, for different security and loan types. Recoveries also tend to be worse in a downturn: the Basel Committee notes that "collateral values may decline" in bad times, so careful models build in a buffer, not just the average case.
These estimates have a floor, too — a minimum a model cannot go below. Under the Basel Framework's CRE32 rules, corporate and bank exposures carry a PD floor of 0.05%, so no model can claim a borrower is completely risk-free. This piece keeps the discussion at the industry level; it does not describe how any specific bank builds or calibrates its models.
How Do IFRS 9 Stages Change the Math?
IFRS 9 — the global accounting rule for loan-loss provisioning — sorts every loan into one of three stages, and the stage decides whether a bank uses a 12-month PD or a full lifetime PD in its ECL math. This one design choice is what makes the same PD × EAD × LGD formula produce very different provision amounts for two loans that look similar today.
IFRS 9 was issued by the IASB (the body that sets global accounting standards) in July 2014 and became effective from 1 January 2018. It replaced an older rule where banks only recognised a loss after a borrower actually showed signs of trouble. IFRS 9 instead asks banks to estimate expected losses at all times, using past data, current conditions, and forecasts — and to update the number every time they report.
| Stage | What triggers it | PD horizon used in ECL |
|---|---|---|
| Stage 1 | Loan is new, or risk has not risen significantly since it started | 12-month PD |
| Stage 2 | Risk has risen significantly (SICR) — presumed once payments are 30+ days overdue | Lifetime PD |
| Stage 3 | Loan is credit-impaired | Lifetime PD |
Plain-language takeaway: the moment a loan's risk rises significantly, the bank must swap a 12-month PD for a full lifetime PD in its ECL formula — long before the borrower actually misses a payment.
Two nuances separate someone who has actually understood ECL from someone who has only memorised the stage table. First, "12-month ECL" does not mean next year's expected cash shortfall. Per the BIS Financial Stability Institute's summary of IFRS 9, it is "the portion of lifetime ECLs associated with the possibility of a loan defaulting in the next 12 months" — a slice of the full lifetime loss, not a separate one-year loss estimate.
Second, the SICR test (the check for a "significant increase in credit risk") tracks the change in PD, not the change in LGD or EAD. The same BIS summary is explicit on this: a bank must assess "the change, if any, in the risk of default over the expected life of the loan (that is, the change in the probability of default, as opposed to the amount of ECLs)." A loan can move to Stage 2 purely because its PD has worsened — even if the rupee amount at risk has not changed at all.
Why Does India Care Right Now?
India's banks are about to be legally required to run this exact PD/LGD/EAD math for the first time. RBI (the Reserve Bank of India) issued final expected-credit-loss directions on 27 April 2026, moving commercial banks from their current loss-recognition method to an ECL framework from 1 April 2027, with the financial impact allowed to phase in through FY 2030–31. These rules are final and dated — not a proposal awaiting approval.
Until that date, Indian banks provision under the older incurred-loss approach — recognising a loss only once a borrower has actually shown signs of trouble, rather than estimating expected losses upfront using PD, LGD and EAD. That gap between today's incurred-loss method and 2027's ECL method is exactly why hiring is picking up now — banks need people who can build these models well before the deadline, not after it.
Some Indian lenders already have a head start. Larger NBFCs (non-banking finance companies) that follow Ind AS accounting — from FY 2018–19 for those with net worth of ₹500 crore or more, and FY 2019–20 for other covered NBFCs — already compute expected credit losses under Ind AS 109, India's version of IFRS 9. Banks are the ones catching up.
The backdrop makes this build-out look even more deliberate than defensive. Gross NPAs (non-performing assets — loans banks have already marked as in trouble) touched a multi-decadal low of 1.8% in March 2026, per RBI's Financial Stability Report released on 30 June 2026. A clean loan book is not a reason to shrink risk teams — it is exactly the kind of moment banks use to invest in better measurement before the new rules take effect.
Which Jobs Use These Numbers Daily?
Analysts who estimate PD, LGD and EAD, and the teams that compute and validate ECL from them, sit inside every bank, NBFC and global capability centre in India's credit risk function. These are not theoretical numbers confined to a textbook — they are recalculated, reported and audited every reporting cycle, which is why the roles behind them are growing.
On pay, AmbitionBox estimates credit risk analysts in India earn ₹12.7–14 lakh per year (1.8k reported salaries, updated 2 July 2026), while Glassdoor's estimate sits at around ₹12.25 lakh average total pay (452 salaries, July 2026). For skills, Indeed India keyword searches on 5 July 2026 showed roughly 35,000 postings pairing Python with credit risk against about 5,000 for SAS — a 7:1 gap that signals where new hiring demand is concentrated, even though these are broad portal counts rather than a formal survey.
We break down the full pay picture — by experience level, employer type and skill premium — in our credit risk analyst salary in India guide. For the wider set of models these teams build beyond PD/LGD/EAD estimation, and the tools and career path behind them, see our guide to what credit risk modeling is. And for exactly how these three numbers reshape under the accounting rules discussed above, read our IFRS 9 ECL model guide.
If you are starting from the basics of assessing a borrower before any model gets built, our credit analysis guide is the right place to begin. It covers the qualitative groundwork — borrower history, financial red flags, collateral and seniority — that every PD, LGD and EAD estimate ultimately rests on.
Frequently Asked Questions About PD, LGD and EAD
PD stands for probability of default — the chance a borrower stops paying. EAD stands for exposure at default — the amount of money at risk when that happens. LGD stands for loss given default — the share of that amount the lender never gets back after recovering collateral. Together they estimate expected loss on a loan.
Expected loss equals PD multiplied by EAD multiplied by LGD, written as EL = PD × EAD × LGD by the Basel Committee. On an illustrative ₹50 lakh loan with a 2% PD and a 40% LGD, this works out to ₹40,000 a year in expected credit loss — the average loss a bank should plan to provision for.
Not quite — PD applies to a group, not one person. A 2% PD means that out of 100 similar borrowers in the same risk grade, about 2 are expected to default within a year. It is a statistical average for the group, the same way a "20% chance of rain" describes many similar days, not one specific day.
Because EAD includes likely future drawdowns, not just today's balance. For a credit card or business credit line, borrowers often draw down more of their limit right before they default. So EAD for revolving credit is estimated closer to the full sanctioned limit than to the amount used today.
No — this is a common mix-up. A 12-month ECL is the slice of the loan's full lifetime expected loss that is tied to a default happening in the next 12 months. It is not a separate calculation of next year's cash shortfall. Under IFRS 9, loans whose risk has risen significantly switch to a full lifetime PD instead.
Not yet. RBI's final ECL directions, issued 27 April 2026, take effect from 1 April 2027, so banks currently still use the older incurred-loss method. Larger NBFCs are ahead of banks here — many have computed ECL under Ind AS 109 since FY 2018–19, giving them a multi-year head start on this exact PD/LGD/EAD math.
Start with the fundamentals of assessing a borrower, then move to statistics and Python on real lending data. QuintEdge's self-paced Credit Risk Modeling course walks through this exact sequence, ending with PD, LGD, EAD and full ECL computation using the IFRS 9 and Ind AS 109 mechanics Indian employers now expect candidates to know.