Comparable Company Analysis at a Glance
Comparable company analysis (comps, or trading comps) values a company by looking at what similar, already-listed companies trade at in the stock market. You take a valuation ratio — most often the P/E ratio (price-to-earnings ratio) — from a group of peer companies, find the typical value, and apply it to the company you are valuing.
Think of it like flat-hunting. You do not value a 2BHK flat from scratch. You check the price per square foot of similar flats in the same locality, then multiply that rate by the size of the flat you want. Comps do the same thing for companies: find the "price per unit of earnings" that the market already pays for similar businesses, then apply it.
Using real NIFTY IT data from screener.in (3 July 2026 close), the five largest listed Indian IT-services peers trade at trailing P/E ratios of 13.2 to 20.6, with a median of 14.5. That single number — the peer median — is the engine of every comps valuation.
What Is Comparable Company Analysis?
Comparable company analysis is a valuation method that prices a company using ratios — called multiples — drawn from similar, publicly listed companies. Instead of forecasting a company's future cash flows yourself, you borrow the market's existing view of similar businesses and apply it directly.
A multiple is simply one number divided by another. The most common one, P/E (price-to-earnings ratio), divides a company's share price by its earnings per share. If a stock trades at ₹200 and earns ₹10 per share, its P/E is 20 — the market is paying ₹20 for every ₹1 of profit that company makes.
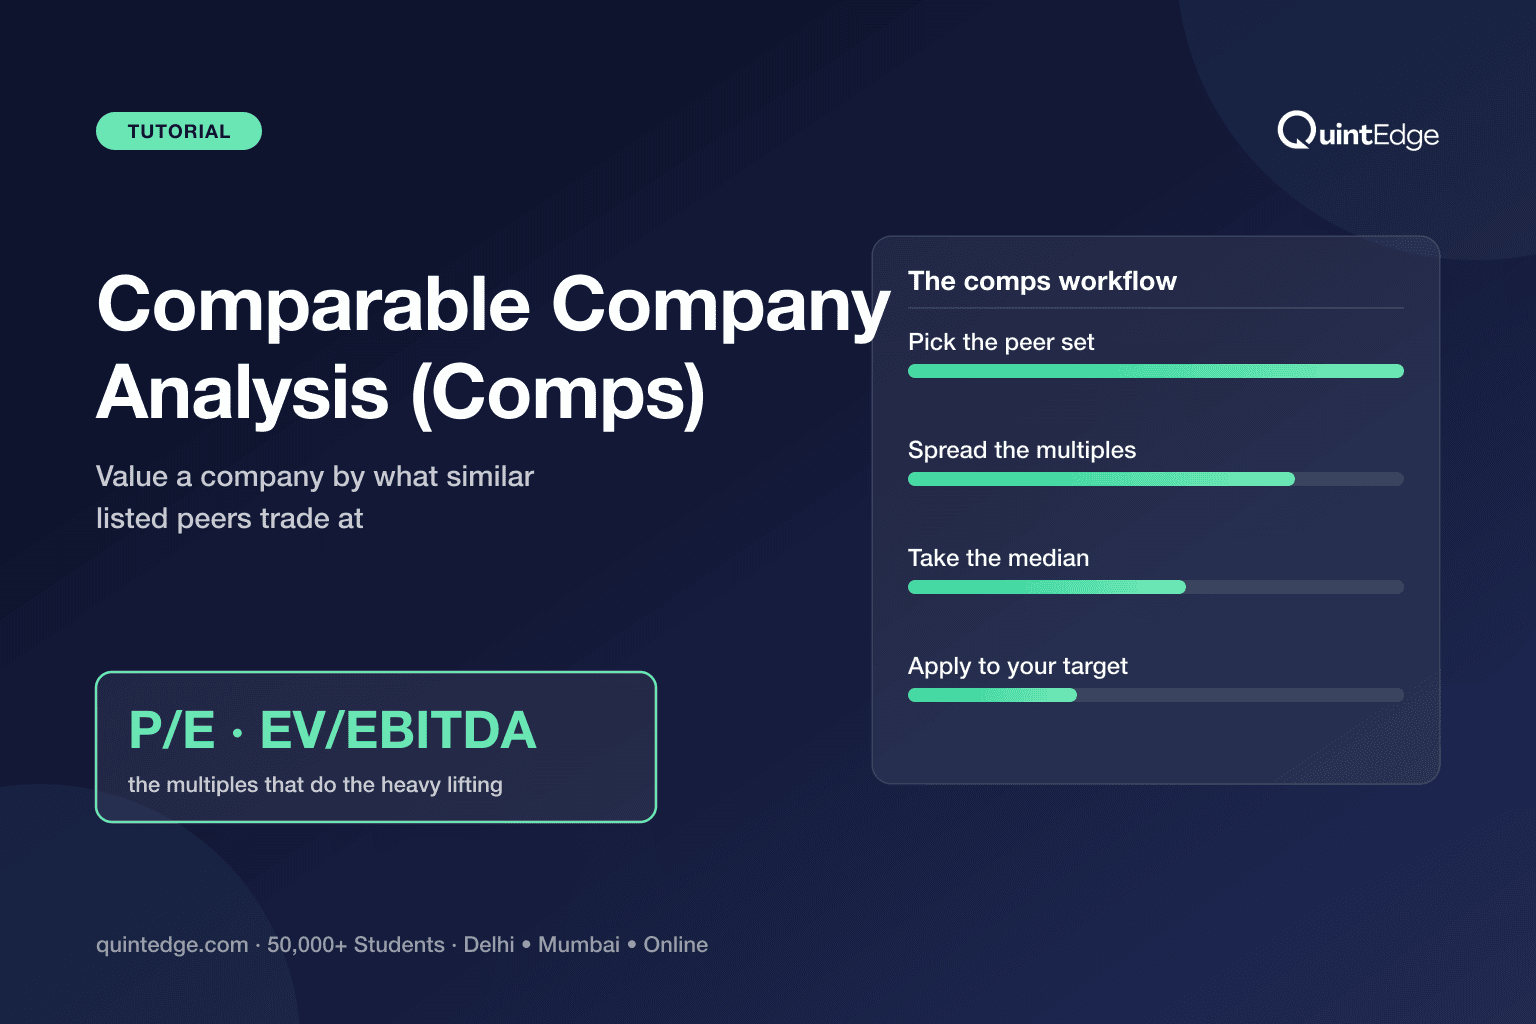
Comps work in three simple steps. First, pick a group of peer companies — same industry, similar size, similar geography. Second, calculate each peer's multiple (P/E, or another ratio covered below). Third, take the typical multiple across the group — usually the median, the middle value when you line the peers up in order — and apply it to your target company's own earnings or other metric.
Analysts prefer comps because they are fast, they use real, observable market prices, and everyone on a deal — bankers, clients, regulators — can check the same numbers on the same day. That is also why comps sit at the centre of nearly every type of financial model used in equity research, investment banking pitches and M&A work.
| Step | What you do | Plain-language check |
|---|---|---|
| 1. Build the peer set | List 4–8 similar, listed companies | Would an analyst covering this sector recognise every name? |
| 2. Calculate multiples | Work out P/E (or another ratio) for each peer | Are you using the same formula and period for every peer? |
| 3. Apply the median | Multiply the peer median by the target's own metric | Does the result sit inside the peer range, not far outside it? |
The one-line takeaway: comps is a three-step process — pick peers, calculate their multiples, apply the typical multiple to your target.
When Do Analysts Use Comps Instead of a DCF?
Analysts reach for comps when they need a fast, market-anchored valuation check, and reach for a DCF (discounted cash flow model) when they need to value a company on its own fundamentals, independent of today's market mood. Most real valuation work uses both, side by side.
A DCF forecasts a company's own future cash flows and discounts them back to today's value — it answers "what should this company be worth, based on what it will earn?" Our DCF model guide walks through that build step by step, including the discount-rate math.
Comps answers a different question: "what is the market actually paying for businesses like this one, right now?" That makes comps the faster, simpler build — you do not need to forecast five years of cash flows — but it also means comps can only ever be as good as the peer group and the current market mood behind it.
- Use comps when you need a quick sanity check, you are pitching a range to a client, or you are valuing a company with a clean set of listed peers.
- Use a DCF when you need a standalone, market-independent value — useful when a whole sector looks cheap or expensive and you want to know what a company is worth on its own numbers.
- Use both when the stakes are high — an IPO price band, an M&A offer, an equity research price target. Bankers and equity research analysts cross-check a DCF value against a comps range before committing to a number.
Comps also feeds into other valuation methods rather than standing entirely apart from them. A private equity fund building an LBO model, for instance, still leans on peer multiples to set the assumed exit multiple — the price the fund expects to sell the company for years later.
How Do You Pick the Peer Set?
A good peer set is a short list of listed companies that an industry analyst would instantly recognise as "the same kind of business" as your target. Get the peer set wrong, and every multiple you calculate afterward is wrong too — this is the single step where beginners make the most mistakes.
Four plain rules keep a peer set honest:
- Same business. Peers should earn money the same way — an IT services exporter should be compared with other IT services exporters, not with an IT hardware maker or a software product company.
- Similar size. A ₹50,000 crore company and a ₹500 crore company rarely deserve the same multiple — size affects growth expectations, funding cost and investor risk perception.
- Similar geography. A company earning most of its revenue from the US market behaves differently from one selling only in India — currency exposure, client contracts and demand cycles all differ.
- Similar growth and margin profile. Two companies in the same industry can still deserve different multiples if one is growing faster or earns fatter margins — note the difference rather than ignoring it.
In practice, analysts usually land on 4 to 8 peers. Too few peers and one odd company can skew your median; too many and you start including businesses that are not truly comparable. The NIFTY IT worked example below uses five peers for exactly this reason — enough for a stable median, few enough that every name is genuinely comparable.
Which Multiples Matter?
The two multiples every beginner should know are P/E and EV/EBITDA — both compare a company's value to a measure of its profit, but they measure value and profit slightly differently, which changes when each one is useful.
P/E (price-to-earnings ratio) divides a company's share price by its earnings per share (or its total market value by its total net profit). In one plain sentence: P/E tells you how many rupees of price the market is paying for every rupee of profit the company makes for its shareholders. It is the simplest multiple to calculate and the one used most often in this post's worked example.
EV/EBITDA divides EV (enterprise value) — a company's total value to both shareholders and lenders, roughly market cap plus debt minus cash — by EBITDA (earnings before interest, tax, depreciation and amortisation — profit before those four items are subtracted). In one plain sentence: EV/EBITDA tells you how many rupees of total company value the market assigns for every rupee of operating profit, before financing and accounting choices are even considered.
| Multiple | Formula | What it captures | When analysts prefer it |
|---|---|---|---|
| P/E | Share price ÷ Earnings per share | Value to shareholders only, after interest and tax | Quick comparisons; widely quoted, easy to find |
| EV/EBITDA | Enterprise value ÷ EBITDA | Value to the whole company (shareholders + lenders), before financing/accounting choices | Comparing companies with different debt levels or tax situations |
The plain-language takeaway: P/E is simpler and more commonly quoted; EV/EBITDA is fairer when peers carry different amounts of debt, because it looks at the whole company, not just the equity slice.
Because EV/EBITDA compares whole-company value rather than just the equity slice, it is the multiple analysts reach for when peers carry different debt loads — a heavily-indebted peer's P/E can look distorted by interest costs, while its EV/EBITDA is unaffected. Any EV/EBITDA figures used later in this post's worked example are illustrative only — current EV/EBITDA multiples for the NIFTY IT peer set were not available from a reliable source at the time of writing, so treat them as a teaching example of the method, not as live market data.
Worked Example: Valuing an IT Company Against the NIFTY IT Peers
This worked example uses real, sourced trailing P/E ratios for five NIFTY IT constituents, then applies the peer median to an illustrative target company. The five peers are the largest listed Indian IT-services companies — the same kind of business, the same broad geography (all earn a large share of revenue from exporting services, chiefly to the US), and comparable size within the sector.
One name needs a quick note first. LTIMindtree was renamed LTM Limited effective 17 March 2026, following board and shareholder approval and a fresh Certificate of Incorporation. This post refers to it as "LTM (formerly LTIMindtree)".
| Company | Trailing P/E |
|---|---|
| TCS | 14.5 |
| Infosys | 14.1 |
| HCL Technologies | 17.8 |
| Wipro | 13.2 |
| LTM (formerly LTIMindtree) | 20.6 |
Source: screener.in, consolidated trailing P/E, 3 July 2026 close, as of July 2026. Different data providers can show a P/E 1–2 points apart for the same company, because they use slightly different earnings periods — always state your source and date.
Line the five P/E ratios up in order — 13.2, 14.1, 14.5, 17.8, 20.6 — and the middle value, the median, is 14.5. Analysts typically use the median rather than the average, because one unusually high or low peer can pull an average off course while barely moving the median.
Before applying that median, it helps to know why these multiples sit lower than many beginners expect. The NIFTY IT index fell approximately 24% during 2026, with TCS down about 33%, HCL Technologies down about 30%, Infosys down about 27% and Wipro down about 31% over the same stretch (BusinessToday, 8 June 2026). The report ties the fall to fears of AI-led disruption to the IT services industry and subdued quarterly and fiscal earnings — relevant context, since Indian IT firms earn over 50% of their revenue from the US. Whatever multiple you see for this sector, always check the date — a P/E of 14–15 looks ordinary in July 2026 but would have looked unusually low against the sector's historical norms just a year or two earlier.
Now the illustrative step: applying that peer median to a target company. Suppose you are valuing an illustrative, unlisted IT services company — call it "TechRupee Ltd" — that reported a net profit of ₹40 crore last year and has 2 crore shares outstanding (illustrative figures, not a real company).
Step 1: Earnings per share (EPS) = Net profit ÷ Shares outstanding = ₹40 crore ÷ 2 crore shares = ₹20 per share.
Step 2: Apply the peer median P/E of 14.5 = ₹20 × 14.5 = an implied share price of ₹290.
Step 3: Implied equity value = ₹290 × 2 crore shares = ₹580 crore.
That ₹580 crore is not a precise, single "correct" answer — it is an implied valuation range. A careful analyst would also apply the lowest peer P/E (13.2) and the highest (20.6) to see the full band the market might support: roughly ₹528 crore to ₹824 crore on the same ₹40 crore profit. The peer median gives you a sensible midpoint to anchor a conversation, not a single guaranteed number.
| Scenario | P/E applied | Implied share price | Implied equity value (2 cr shares) |
|---|---|---|---|
| Low end of peer range | 13.2 (Wipro) | ₹264 | ₹528 crore |
| Peer median (used above) | 14.5 (TCS) | ₹290 | ₹580 crore |
| High end of peer range | 20.6 (LTM) | ₹412 | ₹824 crore |
The plain-language takeaway: the same ₹40 crore profit is worth anywhere from about ₹528 crore to ₹824 crore, depending which peer's multiple you apply — comps gives you a defensible range, not a single fixed answer.
What Are the Pitfalls of Comparable Company Analysis?
Comps looks simple, which is exactly why it goes wrong quietly. The method's biggest weakness is that it borrows the market's opinion — and the market can be wrong, distracted, or looking at a peer that is not really comparable at all.
- Cherry-picked peers. It is tempting to include only the peers whose multiples support the valuation you want to reach. A defensible peer set is chosen using the same rules (business, size, geography) regardless of what answer it produces.
- One-off earnings. If a peer's profit was inflated by a one-time gain — selling a property, a tax refund, an insurance payout — its P/E will look artificially low or high for reasons that have nothing to do with its normal business. Always check what sits inside "earnings" before trusting the ratio.
- Cheap for a reason. A peer can trade at a low multiple not because it is a bargain, but because the market expects its earnings to fall, its industry to shrink, or a specific risk to hit it. A low multiple is a starting question, not an automatic buy signal.
- Stale or mismatched data. Comparing one peer's most recent quarter against another peer's year-old numbers produces a meaningless multiple. Match every peer to the same period and the same earnings definition.
- Whole-sector distortion. When an entire industry falls out of favour — as NIFTY IT did through 2026 — every peer's multiple moves together. Comps alone cannot tell you whether the whole sector is cheap or fairly repriced; that judgement needs a DCF or a view on the sector's future, not just today's peer multiples.
Frequently Asked Questions About Comparable Company Analysis
Comparable company analysis, or comps, values a company using the price ratios of similar, already-listed companies. You find what the market pays for peer businesses — usually measured through the P/E ratio — and apply that same ratio to the company you are valuing. It is like pricing a flat using the going rate per square foot in the same neighbourhood.
Trading comps use the current share prices of listed peer companies — what the market pays for a business today. Precedent transactions use the prices actually paid in past M&A deals for similar companies, which usually include a premium for gaining control. Both are multiple-based methods, but trading comps track the public market and precedent transactions track deal prices.
The median is the middle value once you line up the peer multiples in order, so one unusually high or low peer barely moves it. The average, by contrast, can be pulled well off course by a single outlier. Since a small peer set of 4–8 companies is common, the median gives a steadier, more defensible number to build a valuation around.
Most analysts use 4 to 8 peers. Fewer than that, and one odd company can distort the median; more than that, and the set starts to include businesses that are not truly comparable on business model, size or geography. The NIFTY IT worked example above uses five peers for this reason.
Yes — this is actually one of the most common uses of comps. You take the multiples from listed peers and apply them to the unlisted company's own earnings, exactly as this post's worked example does with an illustrative, unlisted "TechRupee Ltd". Unlisted companies often get a small discount versus listed peers because their shares are harder to buy and sell.
Neither is automatically more accurate — they answer different questions. Comps tells you what the market is paying for similar companies right now; a DCF tells you what a company should be worth based on its own forecast cash flows. Professionals build both and treat any large gap between them as a signal to investigate, not a sign that one method is simply wrong.
Yes. Comps is one of the most frequently tested valuation methods at entry-level investment banking and equity research interviews, alongside the three-statement model and DCF. Interviewers commonly ask you to name multiples, explain how you would build a peer set, or walk through applying a peer median — exactly the steps covered in this guide.