Excel for Financial Modeling at a Glance
Excel for financial modeling is not about knowing every feature. It is about a small "core kit" that does most of the work: 10–12 keyboard shortcuts, 8 formulas, and 3 formatting habits. Learn that kit well, and you build models fast and make fewer errors.
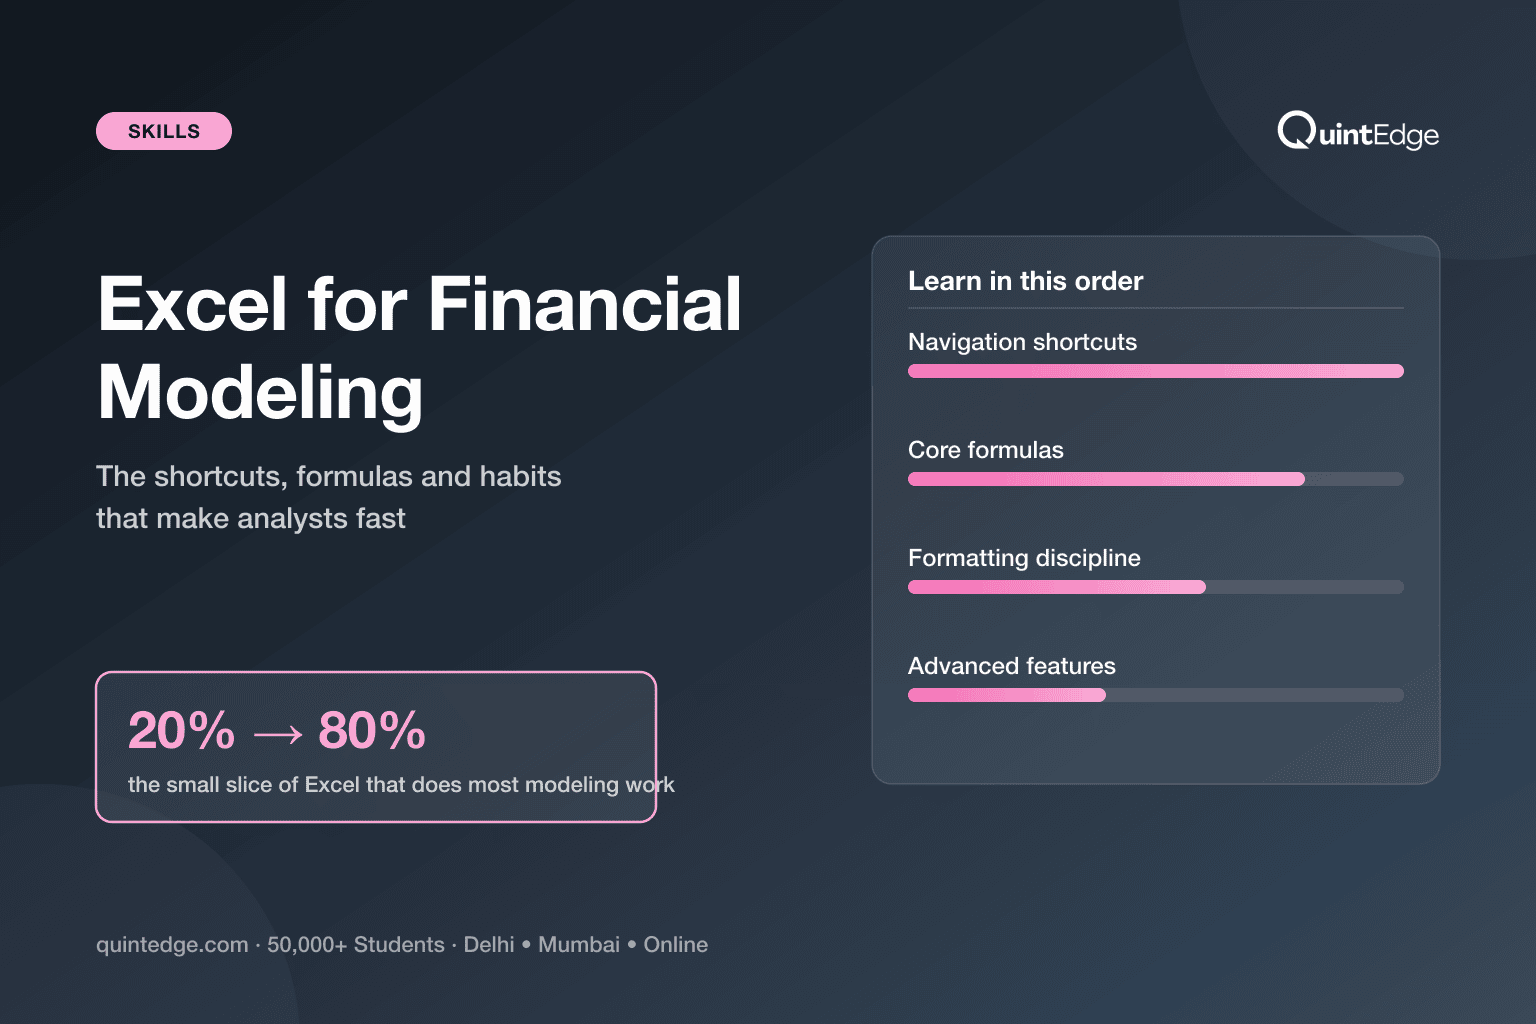
Learn it in this order: shortcuts first (they save time on everything else), then formulas (they do the actual calculations), then formatting habits (they keep your model readable and error-free). Advanced tools like Goal Seek and LAMBDA come last — you will rarely need them in your first year on the job.
This guide covers all three layers in plain language, with small worked examples for every formula. By the end, you will know exactly what to practice and in what order.
Why Does Excel Speed Matter in Finance Jobs?
Excel speed matters because financial models are built and rebuilt under time pressure. An analyst who reaches for the mouse for every task is visibly slower than one who moves through a spreadsheet using only the keyboard — and in a live interview or a late-night deadline, that gap shows immediately.
Think of Excel shortcuts like touch-typing. A slow typist can write the same email as a fast typist — but the fast typist finishes in a third of the time and has energy left to check their work. In modeling, that spare time goes into checking formulas, stress-testing assumptions and catching errors before a client or interviewer sees them.
Speed also signals experience. In investment banking and financial modeling interviews, candidates are often asked to build a small model live, on the spot. Our financial modeling interview questions guide covers the concept questions you will face — this post covers the Excel mechanics that let you answer them under time pressure without fumbling.
Finally, speed reduces errors. Every time you switch from keyboard to mouse and back, you break your concentration on the numbers. Analysts who stay on the keyboard make fewer typos, skip fewer cells, and catch mismatched formulas faster — because their eyes never leave the model.
Which Shortcuts Should You Learn First?
Learn shortcuts in three small groups: moving around a sheet, selecting data, and formatting or editing cells. Together, these 12 shortcuts cover almost everything you do while building a model. Windows keys are listed first; where the Mac key differs, it is noted once in the table.
On a Mac, the general rule is: replace Ctrl with Cmd almost everywhere, except F4 (anchoring), which stays the same, and a few edit keys that use Fn or Option instead. The table below flags each Mac difference individually so you don't have to guess.
| Group | Shortcut (Windows) | Mac equivalent | What it does |
|---|---|---|---|
| Navigation | Ctrl + Arrow key | Cmd + Arrow key | Jump to the last filled cell in that direction |
| Ctrl + Home | Cmd + Fn + Left Arrow | Go to cell A1 | |
| Ctrl + Page Up / Down | Fn + Option + Up/Down Arrow | Move between sheet tabs | |
| Selection | Ctrl + Shift + Arrow key | Cmd + Shift + Arrow key | Select from the current cell to the last filled cell |
| Ctrl + Spacebar | Ctrl + Spacebar | Select the entire column | |
| Shift + Spacebar | Shift + Spacebar | Select the entire row | |
| Formatting | Ctrl + 1 | Cmd + 1 | Open Format Cells dialog |
| Ctrl + B / I / U | Cmd + B / I / U | Bold / italic / underline the selection | |
| Alt + = | Option + Shift + T | AutoSum the adjacent range | |
| Editing | F4 | F4 (same key) | Cycle a cell reference between relative and absolute ($) |
| Ctrl + D | Cmd + D | Copy the cell above down through the selection | |
| Ctrl + ` (grave accent) | Ctrl + ` (grave accent) | Toggle between formula view and value view |
Plain-language takeaway: master the 3 navigation keys and F4 first — they save the most time, on almost every cell you touch.
Two of these deserve a closer look because they are the ones that separate a fast modeler from a slow one. F4 is the anchoring key: press it after clicking a cell reference inside a formula, and Excel cycles through A1 → $A$1 → A$1 → $A1 — locking the column, the row, or both, so one formula can be dragged across a whole row or column without breaking.
Ctrl + Shift + Arrow key is the fastest way to select a long column of numbers — say, 5 years of monthly revenue — without dragging your mouse and risking missing a cell at the end.
Which Formulas Do Analysts Actually Use?
Most financial models run on a small, repeated set of formulas — not the hundreds Excel offers. Learn these 8 well, in plain words and with a small example each, and you can build the vast majority of a working model.
| Formula | What it does, in plain words | Small example |
|---|---|---|
| SUM / SUMIFS | SUM adds up a range of cells. SUMIFS adds up a range, but only the cells that meet one or more conditions. | =SUMIFS(B2:B50,C2:C50,"Delhi") — total sales, but only rows where the city column says "Delhi" |
| IF / IFS | IF checks one condition and returns one value if true, another if false. IFS checks several conditions in order and returns the first match. | =IF(A2>100000,"High","Low") — labels a revenue figure as High or Low against a ₹1,00,000 cutoff |
| XLOOKUP | Looks up a value in one column and returns the matching value from another column — in either direction, unlike its older cousin VLOOKUP. | =XLOOKUP("TCS",A2:A20,D2:D20) — finds "TCS" in the company column and returns its revenue from column D |
| INDEX-MATCH | MATCH finds the position of a value in a range. INDEX returns the value at that position in another range. Combined, they look up a value the way XLOOKUP does — useful where XLOOKUP is unavailable. | =INDEX(D2:D20,MATCH("TCS",A2:A20,0)) — same result as the XLOOKUP example above |
| EOMONTH / EDATE | EOMONTH gives the last date of a month, a set number of months from a start date. EDATE gives the same date, a set number of months later. Both build date schedules for models. | =EOMONTH(A2,3) — the last day of the month, 3 months after the date in A2 (a quarter-end date) |
| NPV / XNPV | NPV discounts a series of equally-spaced cash flows to today's value at a given rate. XNPV does the same for cash flows on irregular, specific dates. | =NPV(0.12,B2:B6) — the present value of 5 yearly cash flows in B2:B6, discounted at a 12% rate |
| IRR / XIRR | IRR finds the discount rate at which a series of equally-spaced cash flows nets to zero. XIRR does the same for cash flows on specific, irregular dates — the more realistic version for real deals. | =XIRR(B2:B6,C2:C6) — the annualised return, using actual cash flow dates in C2:C6 |
| IFERROR | Wraps another formula and replaces its result with a fallback value if that formula would otherwise show an error. | =IFERROR(B2/C2,0) — shows the division result, or 0 instead of a #DIV/0! error if C2 is blank |
Plain-language takeaway: these 8 formulas cover totals, conditions, lookups, dates, valuation (NPV/IRR) and error-handling — the five jobs almost every model needs done.
Two of these formulas need a version caveat, because getting this wrong is a common mistake. XLOOKUP is available in Excel for Microsoft 365, Excel 2024 and Excel 2021 — but Microsoft's own support page states plainly that "XLOOKUP is not available in Excel 2016 and Excel 2019" (Microsoft Support, XLOOKUP function page, as of July 2026). If your college or office runs an older Excel, INDEX-MATCH is your fallback — it does the same job and works in every version.
The IRR family also has a nuance worth remembering: IRR assumes cash flows arrive at equal, regular intervals (say, once a year). XIRR takes actual dates instead, so it handles the messy, real-world timing of deals — a deal that closes mid-quarter, or a dividend paid on an odd date. In practice, most working models use XNPV and XIRR over their plain versions for exactly this reason.
How Should You Format a Model?
A well-formatted model follows three habits: color inputs blue, keep one formula per row, and never hardcode a number inside a formula. These habits look cosmetic, but they are what let another analyst — or you, six months later — trust and audit the model quickly.
Blue-inputs convention. Any cell where you type a raw number — a growth-rate assumption, a tax rate, a starting revenue figure — gets blue font. Every other cell, which contains a formula, stays black. Opening a model and instantly seeing which numbers are assumptions (blue) versus calculations (black) is the single fastest way to understand someone else's work — or spot-check your own.
One formula per row. Every cell across a row should use the exact same formula pattern, just shifted one column at a time — like 5 years of "Revenue × (1 + growth rate)". If one cell in the middle of a row uses a different formula, that inconsistency is where errors hide. Press Ctrl + ` (the formula-view toggle from the shortcuts table) to see every formula on the sheet at once and check this visually.
No hardcodes inside formulas. Never type =B2*1.08 when 1.08 (an 8% growth rate) is really an assumption. Instead, put 8% in its own blue input cell — say, cell B1 — and write =B2*(1+$B$1). If the assumption changes, you edit one cell instead of hunting through every formula that used it.
What Advanced Features Come Later?
Once shortcuts, formulas and formatting are second nature, three more tools are worth learning: Goal Seek, data tables, and LAMBDA. None of these are needed to build a first working model — they solve specific problems you will meet later.
Goal Seek works backwards from an answer. Say you want to know what growth rate makes your model's Year 5 revenue hit exactly ₹100 crore — instead of guessing values by hand, Goal Seek finds the input for you. It lives under Data → What-If Analysis → Goal Seek.
Data tables (also under Data → What-If Analysis) test a formula's result across a grid of two changing inputs at once — for example, how a valuation changes across different combinations of growth rate and discount rate. Our DCF model guide uses exactly this tool to build a sensitivity grid around WACC and growth assumptions.
LAMBDA lets you write your own custom, reusable function and give it a friendly name — useful once you are repeating the same multi-step calculation across many models. It comes with a version catch worth remembering precisely: Microsoft's own support page lists LAMBDA as available in "Excel for Microsoft 365, Excel for Microsoft 365 for Mac, Excel 2024, Excel 2024 for Mac" only (Microsoft Support, LAMBDA function page, as of July 2026) — not Excel 2021, even though XLOOKUP works there. Don't assume every "modern" feature ships together.
One limit worth knowing as your models grow: an Excel worksheet holds a maximum of 1,048,576 rows by 16,384 columns (Microsoft Support, Excel specifications and limits, as of July 2026). You will never approach this in a company model — but it matters if you ever dump a large raw dataset into Excel before summarizing it.
How Do You Practice?
The fastest way to build these habits is a focused 2-week drill, not scattered practice. Spend the first week on shortcuts and formulas in isolation, then the second week combining them inside one small model you build yourself.
- Days 1–3 — Shortcuts only. Open any spreadsheet with data and practice just the 12 shortcuts from this guide. No formulas yet — just move, select and format using only the keyboard.
- Days 4–7 — Formulas in isolation. Pick one formula a day from the table above. Build 5–10 tiny examples of just that formula until you can write it without checking the syntax.
- Days 8–11 — Build one small 3-statement model. Use a real (small) company's numbers — even from an annual report — and force yourself to apply blue-inputs formatting and one-formula-per-row as you go. Our three-statement model guide walks through this build step by step.
- Days 12–14 — Speed-test yourself. Rebuild the same model from scratch, timing yourself, using only the keyboard. Compare your time to Day 8 — the gap is your progress.
Once this drill feels comfortable, the next step is applying it to a real valuation. Our how to make a financial model guide walks through the full build from assumptions to output, and the DCF model guide shows these exact Excel habits used inside a real discounted cash flow model.
Frequently Asked Questions About Excel for Financial Modeling
You need three layers: about 12 keyboard shortcuts for navigation, selection and formatting; 8 core formulas covering totals, conditions, lookups, dates and valuation; and 3 formatting habits — blue inputs, one formula per row, and no hardcoded numbers inside formulas. This guide covers all three in order.
Learn INDEX-MATCH instead of VLOOKUP as your fallback. XLOOKUP needs Excel 2021, Excel 2024 or Microsoft 365 and is explicitly unavailable in Excel 2016 and Excel 2019 per Microsoft's support page. INDEX-MATCH does the same lookup job and works in every Excel version, so it is the safer skill if you don't control which Excel version you'll use.
F4 cycles a cell reference inside a formula between relative and absolute, in this order: A1, then $A$1, then A$1, then $A1. The dollar signs "anchor" the column, the row, or both, so the reference does not shift when you copy the formula across cells. It is the single most useful key for building models with dragged formulas.
Blue font marks "input" cells — ones where a raw number was typed in by hand, like a growth-rate assumption or a tax rate. Every other cell, which holds a formula, stays black. This convention lets anyone open a model and instantly tell assumptions apart from calculations, without checking each cell one by one.
No. Microsoft's support page lists LAMBDA as available only in Excel for Microsoft 365 and Excel 2024 (Windows and Mac) — it is not available in Excel 2021, even though XLOOKUP is. If your version is Excel 2021 and a formula uses LAMBDA, it will not work; you would need to upgrade to Microsoft 365 or Excel 2024 first.
NPV assumes cash flows arrive at equal, regular intervals — once a year, for example. XNPV instead uses the actual date of each cash flow, so it correctly handles deals that close mid-quarter or payments on irregular dates. Most real-world models use XNPV (and its IRR cousin, XIRR) because actual deal timing is rarely perfectly regular.
A focused 2-week drill is enough to build the core habits: a few days on shortcuts alone, a few days on formulas one at a time, then building and timing a small model. Genuine speed on real, messy company models keeps improving for months after that — but the core kit in this guide gets you functional within two weeks.