
Do You Actually Need Python for a Finance Career?
Honest tiering first:
- Must-have — credit-risk modeling, quant roles, data teams at banks and fintechs. The job is Python there.
- Strong advantage — research, FP&A and risk analysis, where one script can replace a day of copy-paste.
- Nice-to-have — core deal work like investment banking. Excel still rules the desk, but automation increasingly separates juniors.
Python is a general-purpose programming language that reads almost like English — which is why finance adopted it over harder languages. And it is the world's most popular language by a distance:
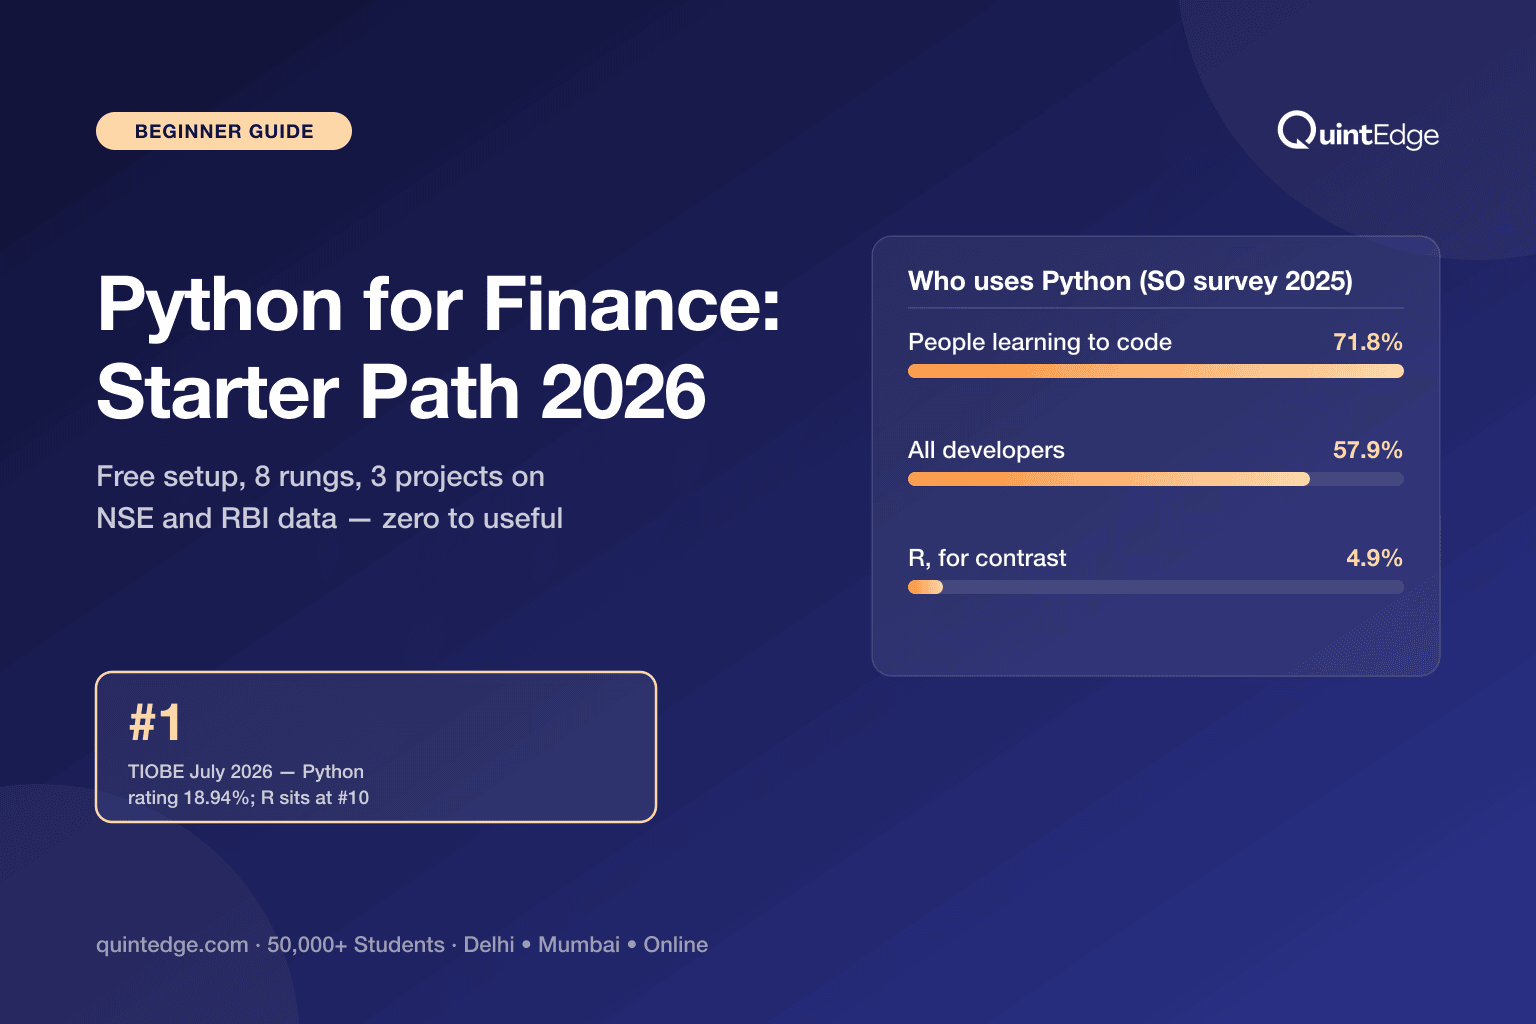
- #1 on the TIOBE index for July 2026, with an 18.94% rating (R, its statistical rival, sits at #10 with 1.69%)
- Used by 57.9% of all developers in Stack Overflow's 2025 survey — rising to 71.8% among people currently learning to code
This guide is the from-zero path for finance people: setup without pain, the only eight things to learn first, three projects on real Indian data, and where the skill leads.
What Does Python Actually Do in a Finance Job?
Five concrete jobs, in rising order of glamour:
1. Cleans data you receive dirty. Bank statements with merged cells, NAV files with three date formats, broker dumps with stray totals — pandas (Python's data library) fixes in ten lines what takes an hour by hand.
2. Joins datasets Excel struggles to. Match 50,000 loan records to repayment histories by ID and date? VLOOKUP groans; a pandas merge() does it in seconds, repeatably.
3. Automates the recurring report. The Monday MIS you assemble by hand becomes a script: read the files, compute the ratios, write a formatted Excel out (openpyxl), every week, identically.
4. Analyses at sizes Excel dislikes. A million rows of NSE trades or ten years of daily prices across 500 stocks — Python handles them without the spinning wheel.
5. Powers the models banks now run on. PD/LGD/EAD estimation, IFRS-9-style ECL provisioning, validation testing — India's credit-risk teams increasingly build these in Python, a shift mapped honestly in Python vs SAS for credit risk.
How Do You Set Up Without Pain?
Day one: skip installation entirely. Google Colab runs Python notebooks free in your browser — Google's own FAQ: "Colab is free of charge to use" (resources are not guaranteed and limits fluctuate, which is fine for learning). Open a notebook, type the code above, done.
When you want it local:
- Install Python from python.org — 3.14 is current as of July 2026; anything 3.12+ is fine for finance work
- Add libraries with
pip install pandas matplotlib openpyxl - Prefer the all-in-one Anaconda distribution? Know its licence: free for individuals, students and small organisations, but paid for for-profit companies above 200 employees (Anaconda's terms, checked in July 2026). At a large employer, use their approved setup.
If your life is Excel: Python now runs inside it. Python in Excel has been generally available since 16 Sep 2024 — calculations run in Microsoft's cloud, no local install, needs a qualifying Microsoft 365 subscription. It is a genuine bridge: pandas answers appearing in a grid you already know. More on the AI-era Excel stack in AI skills for finance professionals.
The Only 8 Things to Learn First
Everything below rung 8 is optional for finance beginners. Climb in order; each rung is days, not months:
| Rung | Learn | You can now… |
|---|---|---|
| 1 | Variables, numbers, strings, lists | Store and label data |
| 2 | if conditions and for loops | Apply a rule across many rows |
| 3 | Functions | Package a calculation (EMI, CAGR) for reuse |
| 4 | pandas: read_csv, head, filtering | Open and inspect any data file |
| 5 | pandas: sort, groupby, new columns | Answer real questions ("average by sector?") |
| 6 | pandas: merge/join | Combine two files by a common key |
| 7 | matplotlib basics | Chart a trend and save it |
| 8 | Reading/writing Excel (openpyxl) | Automate the report your team ships weekly |
Plain takeaway: rungs 4–6 are the job. If time is short, spend 70% of it on pandas.
The Five Libraries That Matter (July 2026 Versions)
| Library | Job | Current stable (Jul 2026) |
|---|---|---|
| pandas | Tables: load, clean, join, aggregate — 80% of your usage | 3.0.x |
| NumPy | Fast math under pandas; arrays, random draws | 2.5.x |
| matplotlib | Charts: lines, bars, histograms | 3.11 |
| openpyxl | Reading/writing real .xlsx files | 3.1.x |
| yfinance | Quick historical market data for practice | 1.5.x — see caveat |
The yfinance caveat, from its own documentation: it is not affiliated with or endorsed by Yahoo — an open-source tool using Yahoo's publicly available APIs, "intended for research and educational purposes." Perfect for learning; never build anything production-grade or commercial on it. For serious Indian data, use the official sources below.
(Versions above verified on PyPI/python.org in July 2026 — check current versions when you install; the code you learn does not change.)
Your First 3 Projects (on Free, Official Indian Data)
Project 1 — NSE bhavcopy explorer. NSE publishes a free daily "bhavcopy" — every listed stock's prices and volumes — downloadable from its reports page with no login. Load it with pandas, filter the EQ series, find the top gainers and most-traded stocks, chart the distribution. This is the code-card project above, extended.
Project 2 — RBI macro dashboard. The RBI's public data portal (data.rbi.org.in — its Database on the Indian Economy) offers over 11,000 economic data series free: repo rates, credit growth, forex reserves, inflation. Download three series as CSV, merge them on date (rung 6!), and chart five years of India's macro story on one figure.
Project 3 — Automate one real report. Take a report you (or a friend) actually assemble by hand — a weekly NAV tracker, a fee reconciliation, an expense summary — and script it end to end: read inputs, compute, write a formatted Excel file out. This one goes on your CV, phrased as an outcome: "automated a weekly report from 2 hours to 2 minutes."
More practice fuel: data.gov.in (the government's open-data platform) and Kaggle's free datasets and browser notebooks. Real files, real messiness — exactly the skill employers mean.
Python vs Excel: When Does Each Win?
Wrong question on the desk: it is Python and Excel, and knowing which tool each task belongs to.
| Task | Winner | Why |
|---|---|---|
| A financial model others must open, audit, tweak | Excel | Universal, visual, reviewable cell-by-cell — the deal-desk standard (Excel for FM) |
| Cleaning/joining large or recurring datasets | Python | Repeatable script beats manual steps every time it recurs |
| One-off quick math on 50 rows | Excel | Faster to open than to script |
| The same report every week/month | Python | Automation is the whole point |
| Statistical/model work (PD curves, simulations) | Python | Libraries exist; Excel strains |
| Presenting numbers to a committee | Excel/PowerPoint | Meet the audience where it lives |
Plain takeaway: Excel is the interface humans share; Python is the engine behind recurring and heavy work. Python in Excel is Microsoft's admission that desks want both in one window.
Where Does Python Take a Finance Career?
Credit-risk modeling is the highest-demand Python-first lane in Indian finance — PD/LGD/EAD build-out and ECL provisioning as banks move through the RBI's expected-credit-loss transition. Start with what credit risk modeling is and PD, LGD & EAD explained; the tooling war is in Python vs SAS, and the adjacent audit function in model validation careers.
Quant and data lanes reward the deepest Python — the engineering-side routes are mapped in finance careers after engineering.
Credentials have caught up, too:
- CFA Program — Python Practical Skills Modules at Levels 1 and 2 (10–20 hours each; completing at least one PSM per level is required for your result to be released — completion-based, no score issued)
- CFA Institute's standalone certificate — Data Science for Investment Professionals: 5 courses, ~100 hours; launch pricing US$1,599, or $1,399 for members
- GARP's Risk and AI (RAI) certificate — an 80-question, 4-hour exam each April and October; fees US$525–750 by tier and timing; GARP suggests 100–130 prep hours
None of these replace hands-on projects. All of them signal where the industry believes the skills are going.
The 30-Day Starter Plan
Forty-five minutes a day. Gates, not vibes:
| Days | Do | Gate |
|---|---|---|
| 1–7 | Rungs 1–3 in Colab: variables, loops, functions. Finance flavour from day one — EMI calculator, CAGR function, simple-vs-compound comparison | You write a working EMI function from a blank cell, no peeking |
| 8–16 | Rungs 4–6: pandas on the NSE bhavcopy (Project 1). Filter, sort, groupby, then merge two days' files | You answer "which 10 stocks traded most?" from a raw file in under 5 minutes |
| 17–23 | Rungs 7–8: chart the RBI series (Project 2), write formatted Excel out | One saved chart + one script-generated .xlsx that opens clean |
| 24–30 | Project 3: automate one real recurring report end to end; write the CV line | The script runs on fresh inputs without edits — and a friend can run it too |
Fall-behind rule: repeat the week rather than skim it — rung 5 without rung 4 collapses. And use an AI assistant the professional way from day one: let it draft code, then make yourself explain every line before running it. Drafting is its job; understanding is yours.
Python for Finance: Frequently Asked Questions
To useful: about 30 days at 45 minutes a day, following the plan above — you will be cleaning files and automating a real report. To job-ready for Python-first roles (credit-risk modeling, data teams): roughly 3–6 months of project work on top, because employers test applied fluency, not syntax recall. The mistake that stretches both timelines is course-hopping instead of building on real files.
Excel first — it remains the shared language of every finance desk, and modeling interviews happen in it (the Excel-for-FM guide). Add Python the month after: the concepts transfer (a pandas DataFrame is a smarter spreadsheet), and the combination is worth more than either alone. Exception: if you are targeting credit-risk or quant roles specifically, run them in parallel from day one.
Python plus domain knowledge can be — Python alone cannot. Data and analytics teams at banks and fintechs hire coders without commerce degrees, but interviews probe whether you understand what the numbers mean: what a default is, why a ratio matters. Pair the language with one domain (credit risk is the most Python-shaped) and one visible project, and the degree question fades. Engineers: your full route map is here.
CFA: Python appears in the Practical Skills Modules at Levels 1 and 2 — 10–20 hours, completion-based, no score; finish at least one PSM per level for your result to release. The main exams are not coding tests. FRM: no coding requirement, though risk employers increasingly expect it — hence GARP's separate Risk and AI certificate. Treat Python as career equipment, not exam equipment.
AI writes first drafts of code very well — which raises the value of the basics. Someone must specify the task, spot when generated code silently drops rows or mishandles dates, and own the output. Thirty days of fundamentals turns AI from a risky shortcut into a force multiplier. The professional pattern — AI drafts, you verify and own — is the core of the AI-skills playbook.
Three official, free sources cover a learner's needs: NSE's daily bhavcopy (full market prices and volumes, no login), the RBI's data portal at data.rbi.org.in (11,000+ macro and banking series), and data.gov.in for government datasets. Kaggle adds curated practice datasets with free browser notebooks. For quick international stock histories, yfinance works for learning — remembering its own caveat: unofficial, research-and-education only.


